- Alternative Data
- Market Data Approach
SMACOM's new value score under development

Factor investing has been the subject of research and experimentation, especially in equity markets, and it has been widely used in the asset management world. Factor investing has become more accessible to retail investors through the development of smart beta indices and listed ETFs that track them, which are based on characteristics of firms such as ROE.
Among investment approaches, value factors have attracted great attention. Historically speaking, the value effect has been particularly strong in Japan. In other words, the average return on stocks that are relatively cheap in terms of value criteria has been higher than the return on relatively more expensive stocks. This fact has led investors to be more interested in value factors. Value factors can be classified into four categories - those related to cash flow, P/L items, B/S items and payout to shareholders and creditors.
It has not been conclusively determined yet whether the value effect is derived from "alpha" or "beta". Following Fama and French (1993), this paper considers market beta, size, and book-to-market ratio plus size-related nonlinear factors to be systematic risk factors. It examines whether value factor information excluding such risk factors has cross-sectional predictive power in relation to stock returns.
Three value factors - cash-flow-based, P/L-based, and payout-based - are used as alphas. These are risk-adjusted alphas constructed with our own methodology to exclude the four systematic risk factors noted above from each value factor. The investment ratio (weight) of each stock has been calculated with the assumption that the target portfolio risk is 5% annually. The investment universe is composed of the stocks listed in the Tokyo Prime market (the first section of the TSE) excluding the financial sector, and the backtesting sample period is from January 2007 to August 2022. The rebalancing frequency is monthly, and transaction costs are not considered.
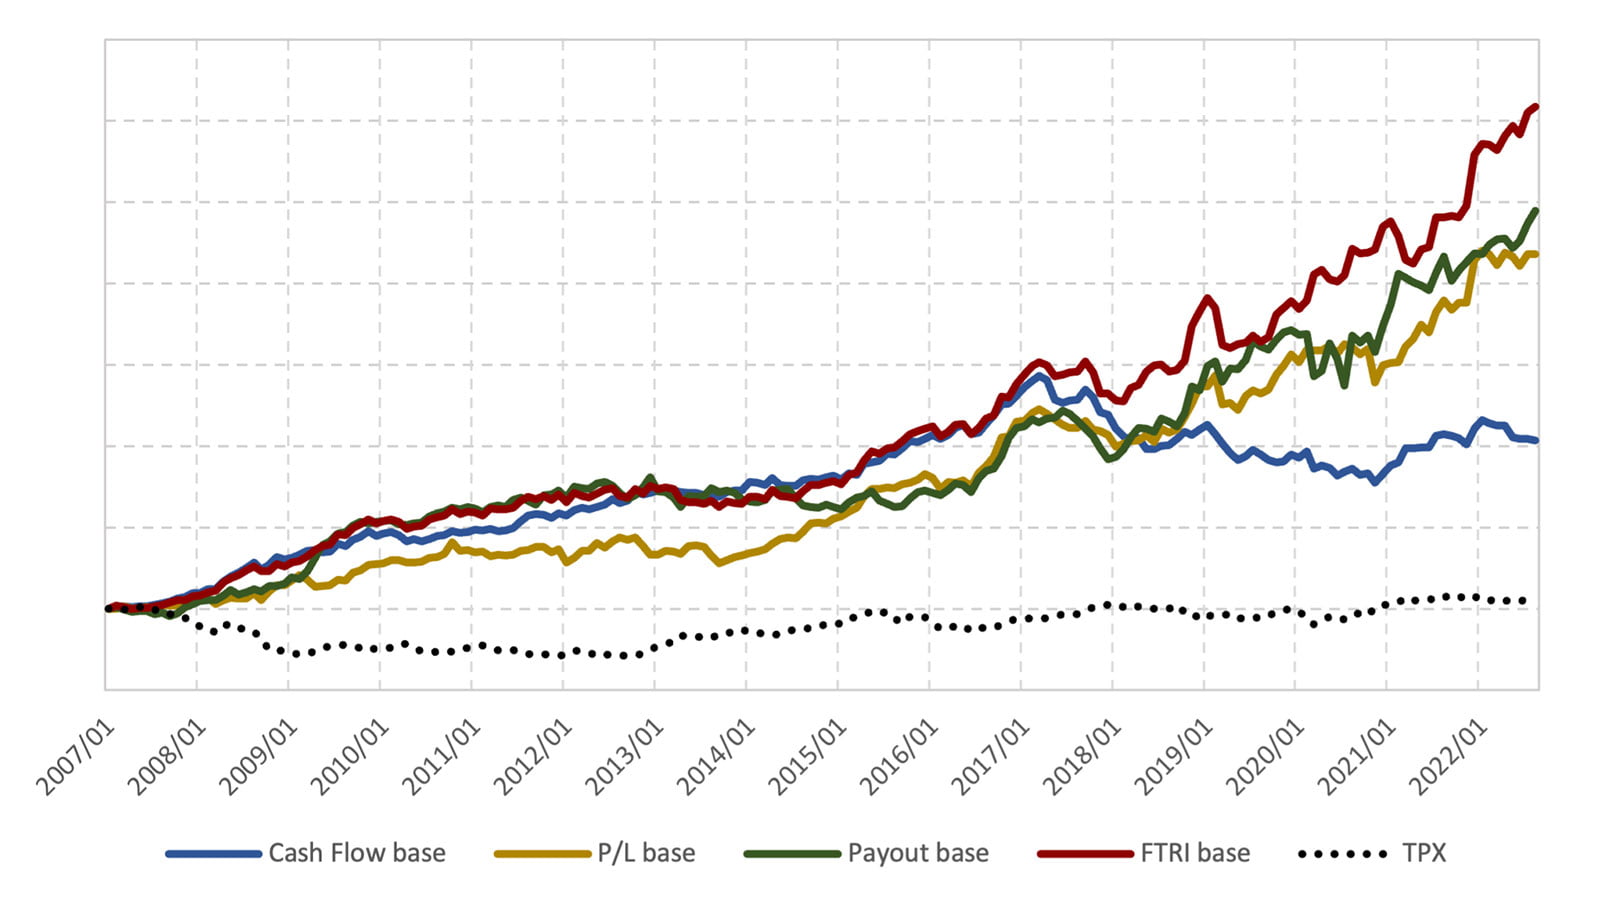
Figure1 Performance of each value factor
Figure 1 shows the performance of each value factor plus an FTRI-based factor that is a composite of the three value factors noted above. The composite weight is calculated according to original FTRI methodology. "TPX" shows TOPIX as a reference. The results indicate that all of the factors outperformed TOPIX. The risk-return ratio (information ratio) for each of the three value factors is around 0.90 (excluding dividends).
Next, taking a look at the FTRI-based factor, its risk-return ratio is 1.34, which demonstrates an improvement in risk-adjusted return. This suggests that consideration of the correlation among the value factors may result in a more efficient portfolio with lower risk.
In general, as the correlation among value factors is relatively high, the diversification effect cannot be expected from value factors alone. However, adding factors having less correlation with them is expected to give rise to a more efficient portfolio. The main factors in question are the quality and momentum factors, which will be explained later. A final matter of discussion is the supposition that a composite thereof (i.e., the value, quality and momentum factors) based on the IC (Information Coefficient) can lead to a more efficient portfolio from a risk-return perspective.
SMACOM: https://www.ftri.co.jp/product/smacom/en
SMACOM free trial (below):
https://www.ftri.co.jp/eng/index.html#company
Disclaimer (PDF file):
https://www.ftri.co.jp/eng/pdf/SMACOM_Disclaimer-EN.pdf
Nikkei FTRI

Nikkei FTRI is a member of the Nikkei Group that works with data analysis technology. We are recognized for the high quality of our analytical and modeling techniques, which utilize both traditional and alternative varieties of data.
See More