- Alternative Data
- Market Data Approach
[QUICK's Alternative Dataset]Financial Results Score

What is the Financial Results Score?
The Financial Results Score is a reference index score statistically calculated by QUICK using artificial intelligence (AI). It is a measurement of the extent of the impact that earnings results and revisions disclosed by companies have on stock prices.
The Financial Results Score is arrived at by taking major revenue items such as sales figures and classifying them based on comparisons with (1) the results from the previous term, (2) the latest company forecasts, and (3) market forecasts (as per the QUICK Consensus). Next, similar patterns in past cases are sought out, and stock price trends are confirmed. Statistically, a positive Financial Results Score indicates that the current earnings results will likely lead to rising stock prices, while a negative Financial Results Score is a sign that the current results are often a harbinger of falling stock prices.
Use cases
The Financial Results Score provided by QUICK allows instant evaluation and quantification of the impacts of announcements on stock prices. At the peak of the corporate earnings season, more than 1,000 companies announce their earnings results in a single day. Therefore, conventionally, investors have faced physical limits with regard to their abilities to gather information and analyze earnings results.
Using the Financial Results Score as a reference index simplifies the users' information-gathering and analytical processes. It allows for the immediate extraction of surprising earnings results.
Predicting stock price changes with the QUICK Financial Results Score
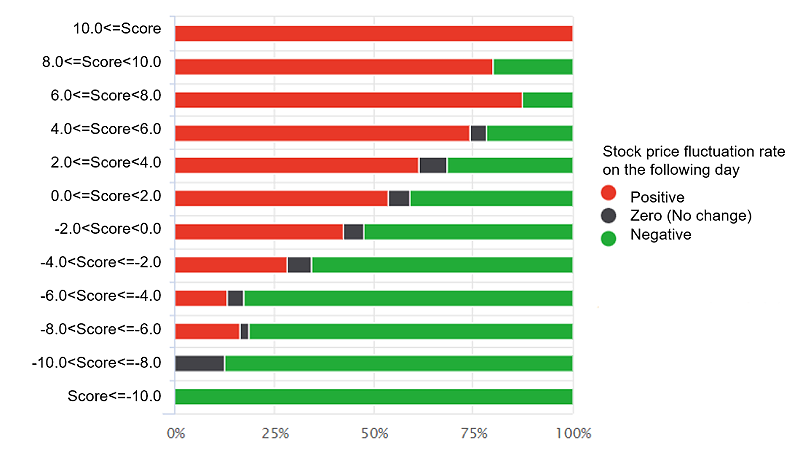
We conducted a validation study for the fiscal year ending March 31, 2022 by comparing the Financial Results Scores and stock price fluctuation rates of companies on the day following announcements. As a result, it was discovered that the predicted values of the Financial Results Scores generally matched the stock price movements. In particular, for companies with high absolute Financial Results Scores that were predicted to greatly impact stock price, the direction of such scores and the stock price fluctuation rates demonstrated high degrees of correspondence.
Period
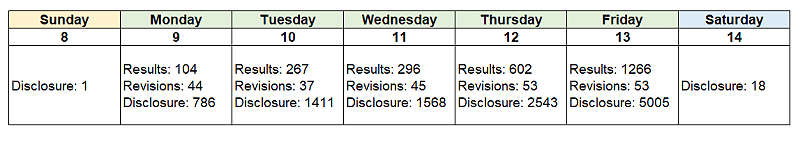
The verification period was from May 8 to May 14, 2022, when many of the most recent earnings results were announced. During the relevant period, there were 2,767 timely TSE disclosures for which Financial Results Scores were calculated, and the breakdown is as follows..
Validating the accuracy of the Financial Results Score
We created a distribution chart using the announcement data for one week from May 8 to 14, 2022, with the vertical axis representing the stock price fluctuation rates on the day following announcements by each company and the horizontal axis representing the Financial Results Score for each such company. A linear approximation was performed to result in a representation of the rough trend of the data as a straight line. The results showed a positive correlation between Financial Results Scores and stock price fluctuation rates.
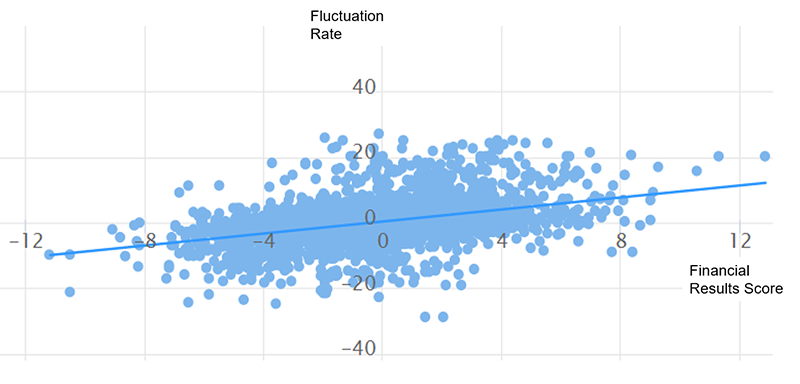
When limited to data with an absolute Financial Results Score of 4.0 or higher, which had been expected to have a huge impact on stock prices, the concordance rate between such score and stock price fluctuation rates was found to be 73.3% (636/867).
The company with the highest Financial Results Score
The earnings announcement by Nishimoto (9260) on May 13 for the first quarter (January-March) of the fiscal year ending December 31, 2022, delivered the highest Financial Results Score during the validation period, at 12.86. The next business day, the stock price fluctuation rate was 20.21%, and the direction of the Financial Results Score and the fluctuation rate matched.
We confirmed the announcement, which showed that the company's consolidated ordinary income had increased sharply to JPY3.19 bn, or 2.7 times that of the same period last year, and its full-year ordinary income had been revised upward by as much as 91.5%.
![[Earnings Results for 1Q] Financial Results Score: +12.86 [Earnings forecast (Full-year)]](/nikkeiinfo/en/global_services/img_FinancialResultsScore_04.PNG)
The usefulness of the QUICK Financial Results Score
The Financial Results Score features both the immediacy of a rapid and automatic calculation conducted as soon as a company announces earnings results or revisions, and the convenience of a quantitative indication of an announcement's impact on stock prices.
The Financial Results Score uses AI to statistically calculate the impact on stock price without human intervention. This information is extremely useful for those seeking to instantly pinpoint noteworthy companies within vast amount of disclosed materials.
QUICK provides the information through its "QUICK Data Factory" data platform, which makes data from 2010 available for all listed companies in Japan.
QUICK

Since its founding in 1971, QUICK has become Japan's largest financial information vendor, and has developed an information infrastructure that supports Japan's securities and financial markets. It delivers high-value global market information from a fair and impartial perspective to a wide range of customers including securities firms, banks, institutional investors and corporations.
See More