- Alternative Data
Anomaly Detection in Financial Statements Using Generative Adversarial Networks

In recent years, there has been an increase in the number cases of financial statement correction following the revelation of accounting irregularities (including window dressing and inappropriate accounting). There have also been cases in which companies voluntarily correct their financial statements even if they have not committed fraud. Credit risk (i.e., default risk) can appear inordinately low when calculated based on pre-correction financial statements that paint a rosier picture than those created with more realistic figures. If a given company goes bankrupt as a result, there will be a significant impact on overall future credit management. Therefore, a model that can be used to evaluate the credibility and validity of financial statements is considered necessary to correctly assess credit risk.
In our "Stories" of November 1, 2023, we reported on changes in the creditworthiness of listed Japanese companies over the period from the outbreak of COVID-19 until its end. To do so, we used the DEFENSE Credit Rating Index (DCRI) calculated via DEFENSE, a product of the Nikkei Financial Technology Research Institute (or Nikkei FTRI). Among the credit-risk-related information it generates using stock price and other financial information, DEFENSE also provides daily scores based on a predictive model for detecting accounting fraud. It is a statistical model that estimates the likelihood that accounting corrections will be made for actual cases. Financial indicators processed from financial statement accounts are input into the model, which then outputs a score derived from the probability of fraudulent accounting. The accuracy of this score in predicting financial statements that have been subjects of surcharge orders imposed by the FSA is 0.775, which is the area under the ROC curve. This can be considered a sufficiently high figure considering that use of the model is a difficult task compared to default prediction.
With the statistical model, it is possible to determine which financial indicators drive up the probability of accounting fraud through contribution decomposition. However, in the case of financial indicators that are highly processed through the combination of several accounts, it is difficult to identify which accounts are abnormal, and it is also difficult to link such information to subsequent actions. In response, we searched for an analytical method that would allow us to identify abnormal accounts by simply using accounts on financial statements as input. We thus came up with the idea of using GANomaly, an abnormality detection method that employs a Generative Adversarial Network (GAN). GANs have been developed mainly in the field of image diagnostics for tasks such as detecting anomalies in images. The idea of implementing this method emerged from a case study in the field of accounting and auditing, where GANs were applied to the task of detecting anomalous transactions in journal data. Our research applies the GANomaly method to financial statements, but we have not been able to find any similar case studies, so we understand that our work in this area is very ambitious and challenging.
Fig 1. GANomaly network structure (schematic diagram)
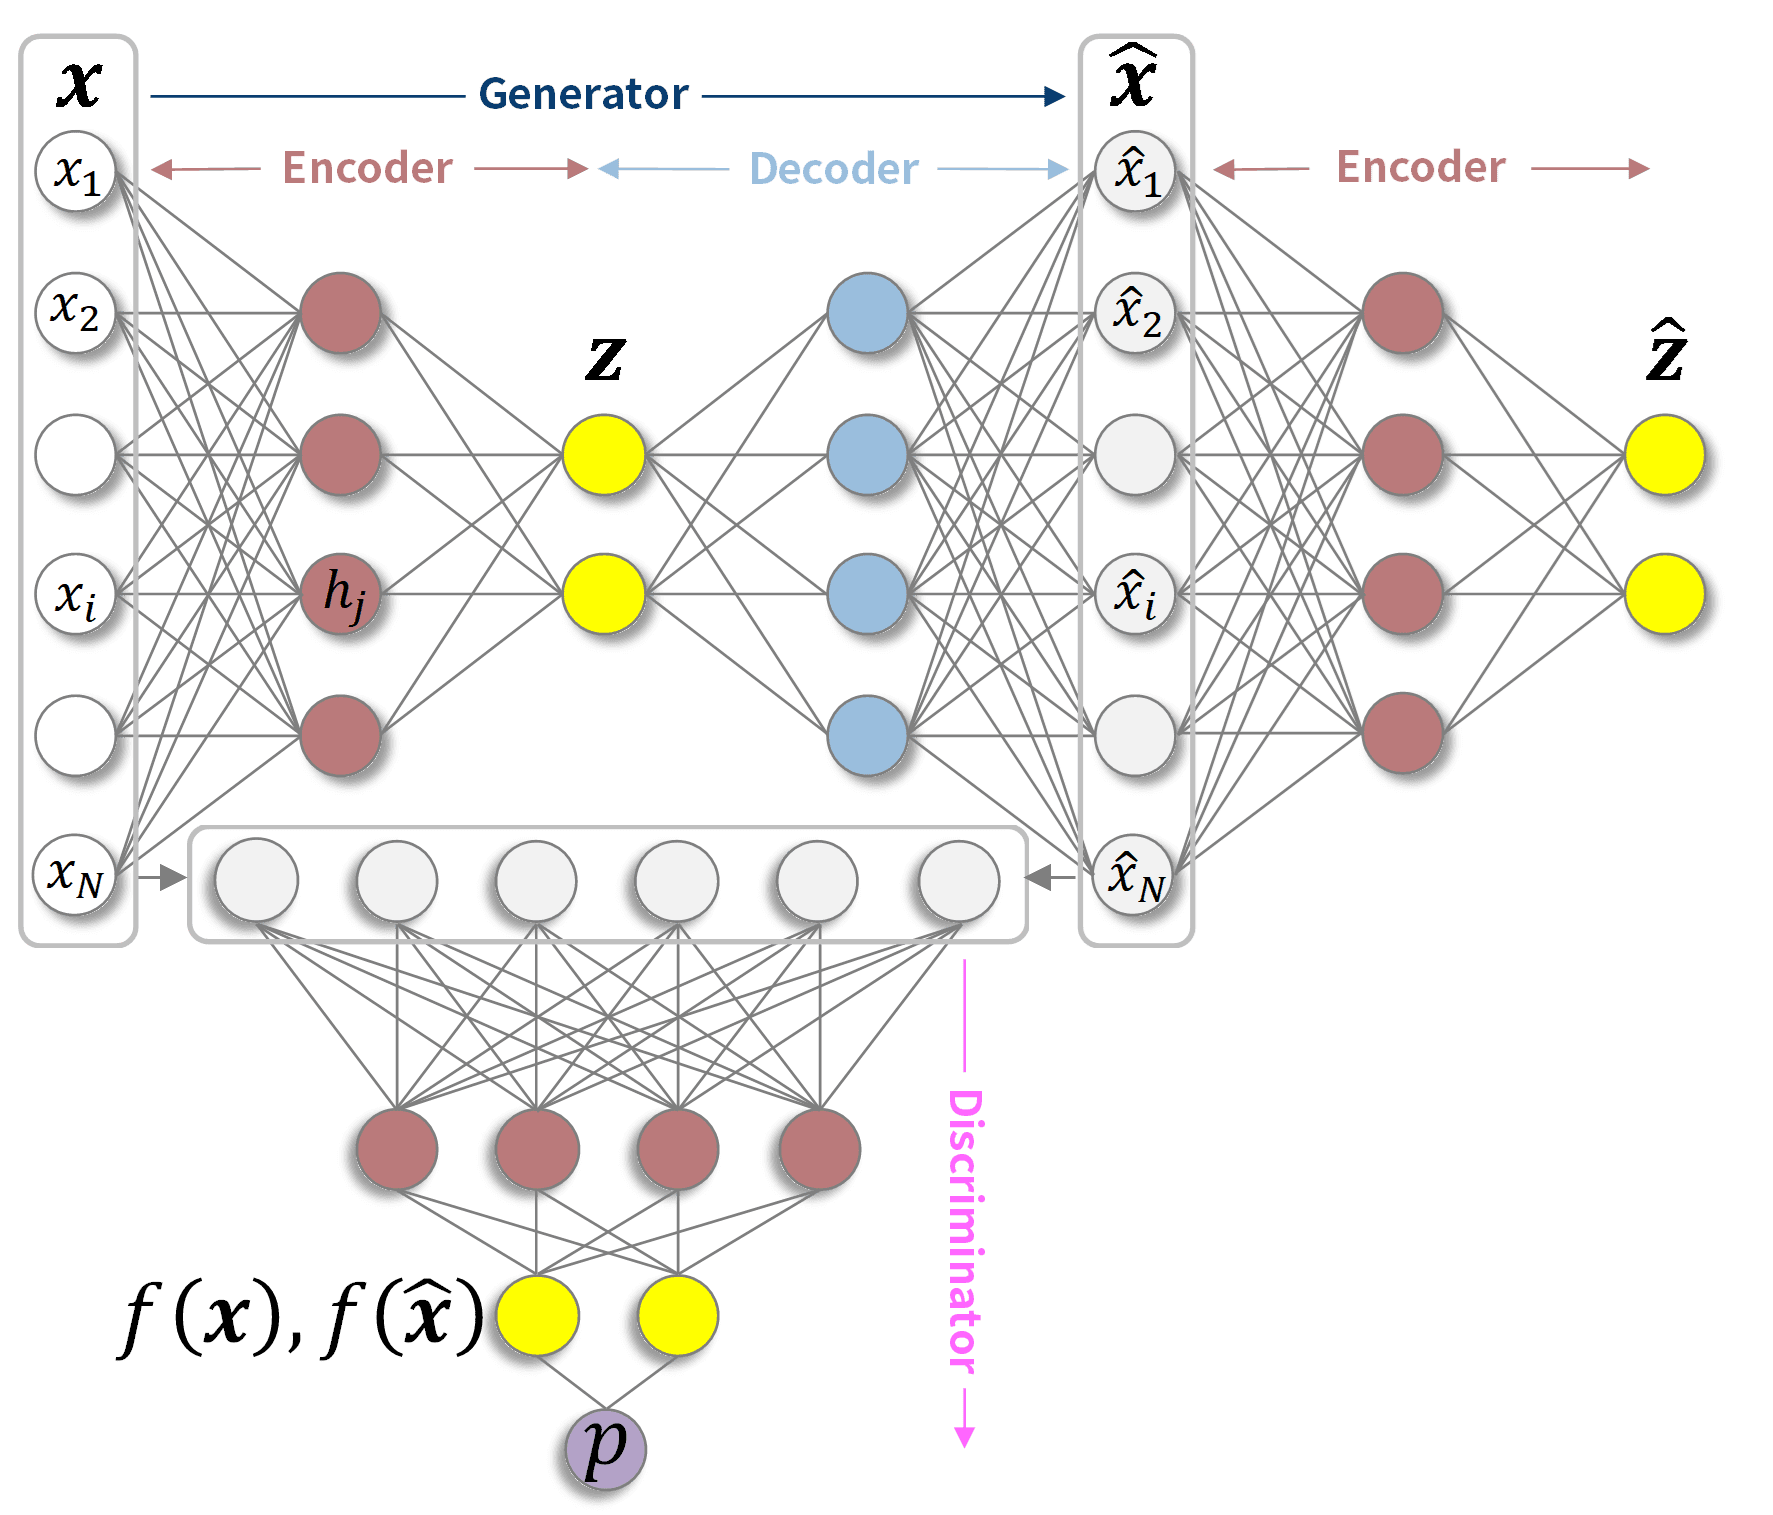
Fig. 1 is a schematic diagram of a GANomaly network structure. In reality, the numbers of nodes and intermediate layers depicted by the circles are large. A GANomaly is composed of a Generator and a Discriminator, which are adversaries that create reconstructed data (^x) similar to the input data (x). The Generator encodes the input data (x) into a smaller number of latent variables (z) than the number of variables input by the Encoder, which is then decoded by the Decoder to create the reconstructed data (^x). The Discriminator receives real input data (x) and fake reconstructed data (^x) and trains model parameters to determine their truth or falsity. In addition to reducing the difference between x and ^x, the Generator also reduces the difference between the latent variable z and the latent variable ^z obtained by re-encoding the reconstructed data ^x, and for the intermediate layer f disposed in front of the layer that outputs the Discriminator's true-false decision probability (p), it reduces the difference between f(x)and f(^x). The third-party check by the discriminator generates reconstructed data (^x) that is more difficult to distinguish from the input data (x).
The model parameters are learned using only financial statements that have no anomalies or for which it is unknown whether anomalies exist or not. If abnormal financial statement samples are input into a model built using financial statements that are not considered abnormal, it will not be possible to reproduce the abnormal accounts that are not included in the sample at the time of training, and therefore the latent variables and reconstructed data will be less likely to show the characteristics of those abnormal parts. Therefore, the difference between the reconstructed data and the input data, which is called the reconstruction error, can be compared for each account to identify the abnormal parts of the relevant financial statements.
In fact, we applied this method to the financial statement data of a listed Japanese company. The number of accounts used as input data amounted to 134 dimensions over three periods, and the figure for latent variables was 32 dimensions. Financial statements that had been revised later and had a surcharge order or misstatement accusation or had a high profit adjustment ratio and net asset adjustment ratio were excluded from the samples for the training. Of the remaining samples, 75% were used for training and the remaining 25% and the samples excluded due to financial statement corrections were used for validation.
Fig2. 2D planar mapping of reconstruction errors (left: plot of samples; right: percentage of financial statement corrections)
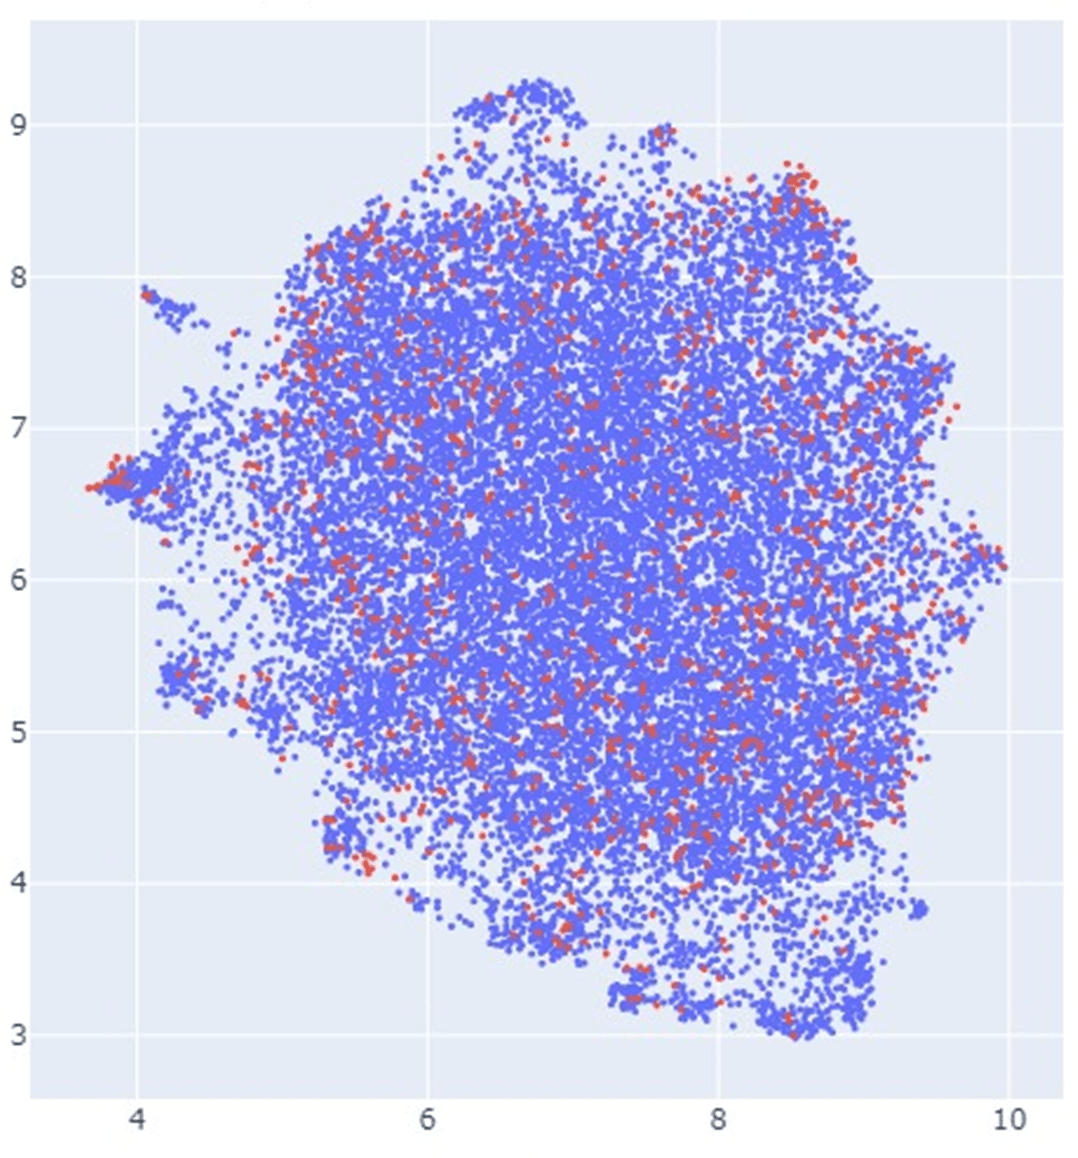
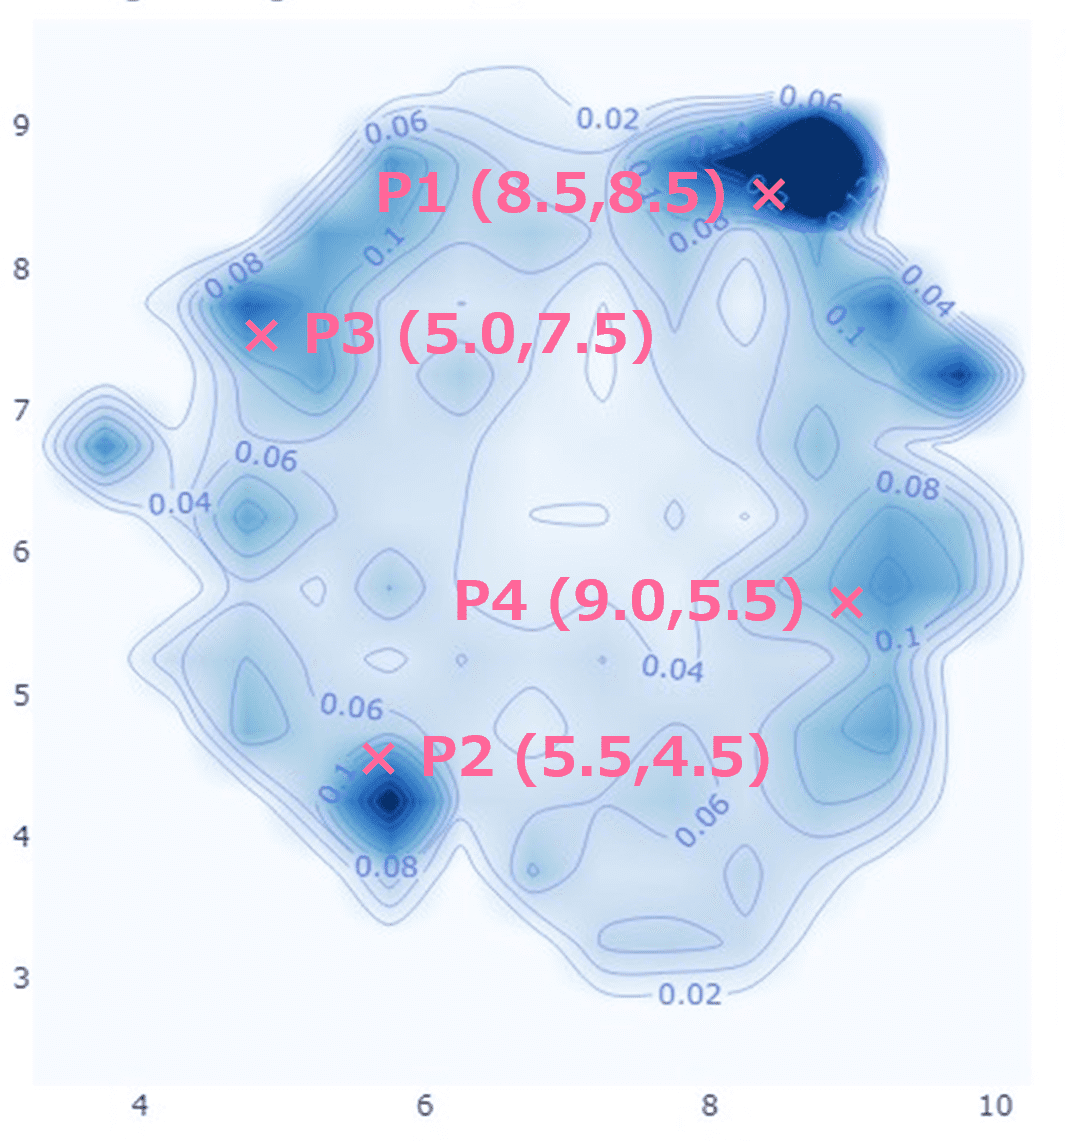
Fig. 2 shows a mapping of account reconstruction errors in a 134-dimensional space embedded in a two-dimensional plane. In the left figure, the blue dots represent samples without account statement corrections, and the red dots represent samples with account statement corrections at a later date. The right figure shows the distribution of the percentage of red dots among the total; i.e., the percentage of corrected financial statements. In general, the further away from the center, the larger the reconstruction error, indicating that such marginal areas have a high percentage of corrected financial statements.
Table1. Reconstruction errors by account estimated at representative points
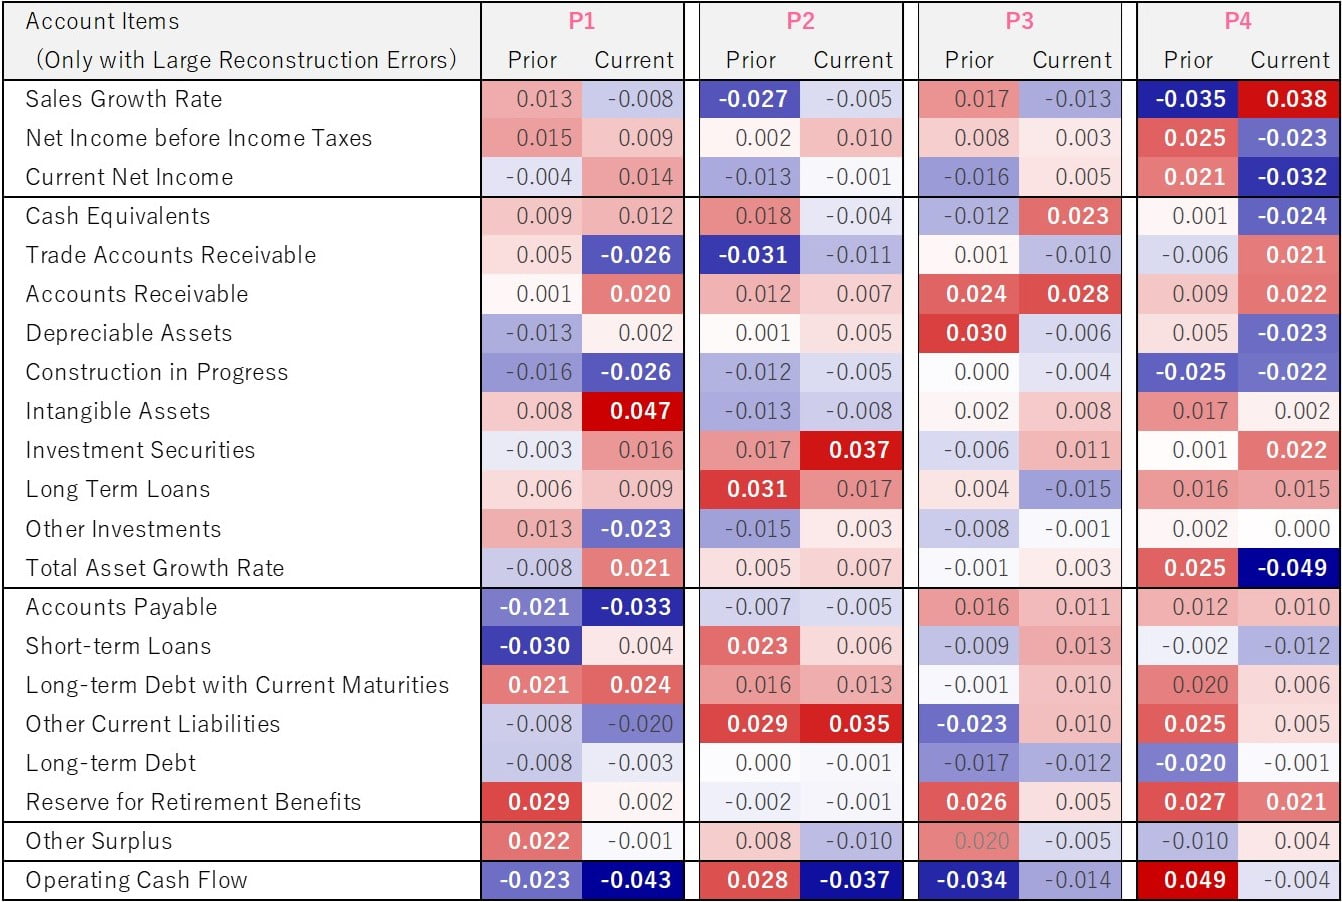
Table 1 shows the estimated reconstruction errors by accounts at the four representative points on the right-hand side of Fig. 2. Only accounts with large reconstruction errors in the last two fiscal years are shown here. At all representative points, the operating cash flow reconstruction error was significant. In general, cash flow statements, especially operating cash flow, are important in detecting accounting fraud, even in traditional analysis and statistically derived models. Below we will look at the reconstruction errors for the other accounts for each representative point.
P1: More intangible assets, fewer accounts payable.
P2: More investment securities, long term loans, and other current liabilities.
P3: Accounts receivable figures are high.
P4: Low (high) income and low (high) total asset growth rate despite high (low) sales growth rate.
In each case, we were able to capture the characteristics that have been pointed out in previous analyses, such as accounts that are easy to manipulate in accounting by themselves, accounts that easily induce unhealthy assets, or the inverse correlation between sales and income. Finally, we would like to emphasize that although it is time-consuming to create accounting fraud flags and financial statement correction flags, the ability to detect anomalies in financial statement accounts even without such flags is a great advantage in practice.
If you are interested in our services, please feel free to contact us.
https://www.ftri.co.jp/eng/index.html#company
Nikkei FTRI

Nikkei FTRI is a member of the Nikkei Group that works with data analysis technology. We are recognized for the high quality of our analytical and modeling techniques, which utilize both traditional and alternative varieties of data.
See More