- Alternative Data
- Market Data Approach
Investment Strategies Using Access Ranking Data

It has been revealed that the access ranking of stocks provided by QUICK's "Qr1" financial information terminal allows users to develop effective investment strategies, especially for short-term management.
What is Qr1 Access Ranking?
The "Qr1 Access Ranking" shows how often individual Japanese stock information has been accessed by "Qr1" terminal users on a daily and 30-minute basis.
QUICK is a financial information provider in Japan with a high market share of over 90%, especially in the Japanese securities retail sector. In Japan, even with the growing popularity of online securities brokers, many transactions are still conducted through financial advisors at brick-and-mortar locations. Many Japanese financial advisors use QUICK's "Qr1," and information on their access reflects the interest in the market.
Recently, using daily aggregate data, there was an examination of the relationship between the scores, which are independently calculated based on the access ranking information for each stock (hereafter the "Rank") and access information, and the abnormal returns (the actual return minus the TOPIX return, which is the excess return for an individual stock after eliminating the stock price fluctuation factors common to all stocks).
Access Ranking Useful as Investment Information
Three investment strategies were examined using data from the "Qr1 Access Ranking." The results showed that all of the investment strategies produced short-term returns, and that a more effective investment strategy could be developed by combining the information.
1. Long Strategy Using the Ranks
First, the performance of a long strategy that holds the top access ranking stocks was examined, using the Ranks alone.
The relationship between the Ranks and abnormal returns is shown in the figure below. The horizontal axis indicates the number of days the stock has been held, and the vertical axis represents abnormal returns. The results of the backtest from January 2019 to May 2022 are shown here.
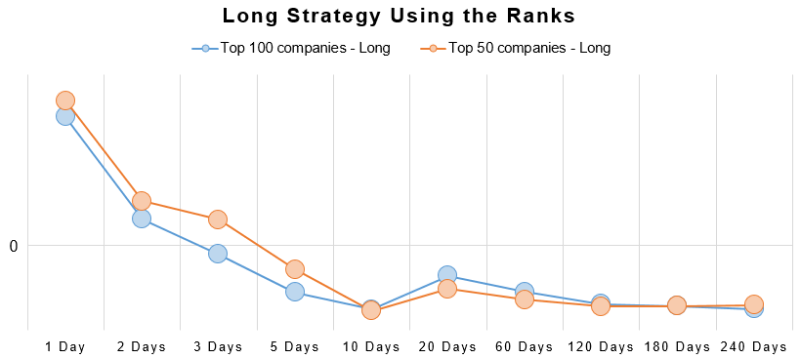
Using the Ranks of the top 100 companies in the daily access ranking, the figure shows the abnormal returns from one day to 240 days after holding all stocks in the top 100 companies (blue line in the figure) and holding only stocks in the top 50 companies (orange line in the figure). From the information on the Ranks, abnormal returns can be obtained up to one to three days later, but not beyond that time. Upon reaching the top of the ranking, the stocks may have attracted attention in the market and their stock prices may have risen. Still, for the three days, the returns exceeding the benchmark could be obtained.
2. Long Strategy Using the Scores
Next, a logistic regression model was constructed to predict the probability of obtaining an appropriate abnormal return. This was done considering both risk and return, using the Ranks and increase/decrease in the number of accesses as explanatory variables. Then, the probability calculated from the model was transformed to compute a score that followed a normal distribution from 1 to 100 points. Higher scores were interpreted as preferable. Here, the performance of a long strategy holding stocks with high scores was examined.
The figure below examines the relationship between the scores and abnormal returns.
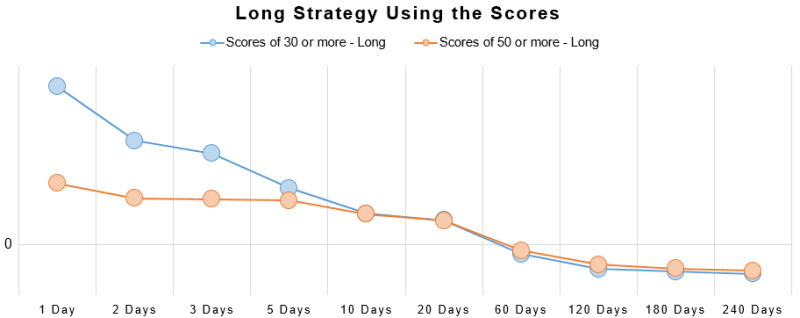
Whether holding stocks with scores of 30 or stocks with scores of 50 or more, in both cases, the result was that a positive abnormal return could be obtained until approximately one month (20 business days) had passed. Portfolios with scores of 30 or more were able to obtain higher abnormal returns within a shorter period of time. On the other hand, portfolios with scores of 50 or more were able to earn stable abnormal returns from one day to one month had passed.
Thus, it is possible to create a more effective investment strategy using, in addition to the Rank information, the increase/decrease in the number of accesses and the scores processed from such information.
3. Long-Short Strategy Using the Scores
High-profile stocks do not necessarily rank high due to positive factors. Therefore, performance was examined by combining the short strategy as well as the long strategy mentioned above.
The figure below compares abnormal returns of the long and long-short strategies. It was also confirmed that higher abnormal returns could be obtained when shorting stocks with scores of 10 or less, as shown in the figure below.
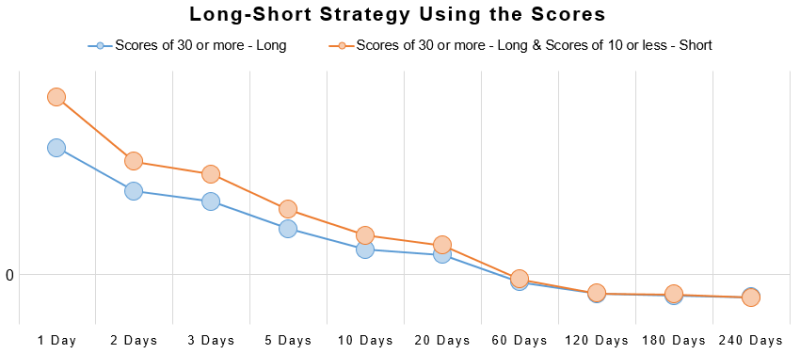
Performance was further improved by combination with the short strategy. Analyzing the characteristics of the access ranking data is likely to help create more effective investment strategies.
Combining and Utilizing the Ranking Data
This verification revealed that it was possible to develop effective investment strategies by properly combining access information. It can be concluded that access ranking is a useful investment decision-making tool. It is worthwhile to continue analyzing data to verify how to formulate optimal investment strategies by analyzing the characteristics of the data, and to verify whether access information, which reflects market interest, precedes stock prices.
QUICK provides information through its QUICK Data Factory data platform. QUICK also offers historical data in addition to the highly preliminary aggregated access ranking data on a daily and 30-minute basis.
Qr1 Access Ranking on QUICK Data Factory
https://corporate.quick.co.jp/data-factory/en/product/data022/
QUICK

Since its founding in 1971, QUICK has become Japan's largest financial information vendor, and has developed an information infrastructure that supports Japan's securities and financial markets. It delivers high-value global market information from a fair and impartial perspective to a wide range of customers including securities firms, banks, institutional investors and corporations.
See More