- Business Solution
- ESG
- Market Data Approach
Effectiveness of Investment Methods Using Non-financial Information (ESG Scores)

1. ESG Score-based Index Shows Higher Stock Returns than TOPIX
The growing public interest in ESG (Environment, Social, and Governance) issues is forcing the investment world to respond. However, the evaluation of ESG-related matters basically demands non-financial information, which makes it difficult to verify the effectiveness of taking ESG issues into account in relation to stock investment. As one way to tackle the problem, the QUICK Corporate Valuation Research Center created four indices of listed stocks in Japan using ESG scores developed by Arabesque S-Ray GmbH, a German ESG evaluation company, and it then examined their performance.
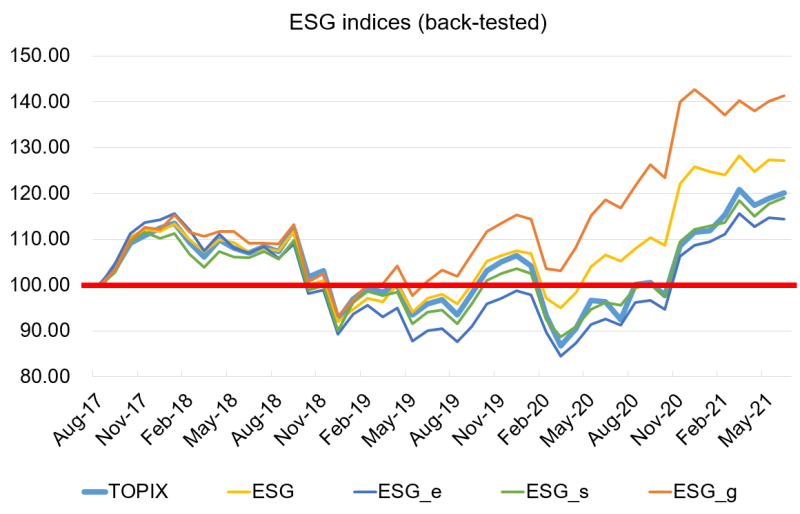
In the first stage, we screened stocks based on liquidity, and in the second stage, we selected the top 100 stocks using four types of ESG scores (ESG total score and ESG sub-scores (E, S, and G)). From the end of August 2017 to the end of July 2021, the index based on the ESG total score showed higher stock returns than TOPIX.
2. Method of Selecting Stocks for Index Inclusion
Stocks were screened for index inclusion in the following two stages based on the criteria described below.
(1) Stage 1
The first screening stage is as follows:
Target: Listed stocks in Japan (common stocks)
Stocks must rank among the top 1,800 for all of the following factors to meet the criteria of Stage 1.
1. ROE
2. Market capitalization
3. ILLIQ (calculated based on 250 days of daily data)
4. Trading value (daily average for 250 days)
ROE was used as an indicator of profitability, market capitalization as an indicator of company size and ILLIQ (which relates to stock illiquidity), and trading value as an indicator of stock liquidity.
From among the stocks that meet the above criteria, 500 are selected to maximize market capitalization.
(2) Stage 2
The second screening stage is as follows:
Target: 500 stocks selected in Stage 1 above
The top 100 stocks in terms of each of the following four ESG scores calculated by Arabesque S-Ray are selected.
1. ESG total score
2. ESG sub-score (E)
3. ESG sub-score (S)
4. ESG sub-score (G)
The ESG total score is an evaluation that takes into account ESG issues with a significant impact on corporate performance by industry and their influence on stock prices. However, the ESG sub-scores only evaluate the characteristics of each ESG theme (E: environment; S: society; G: governance).
(3) Selection of stocks for index inclusion and replacement
The selection of stocks for index inclusion and replacement each take place twice a year in accordance with the following schedule.:
Selection of stocks for inclusion: End of January and end of July every year
Replacement: End of February and end of August every year
(4) Index calculation method
The base date is August 31, 2017, and index score was set at 100 for such date. Index calculation takes place using a market capitalization-weighted average of the relevant stocks at times of biannual replacement.
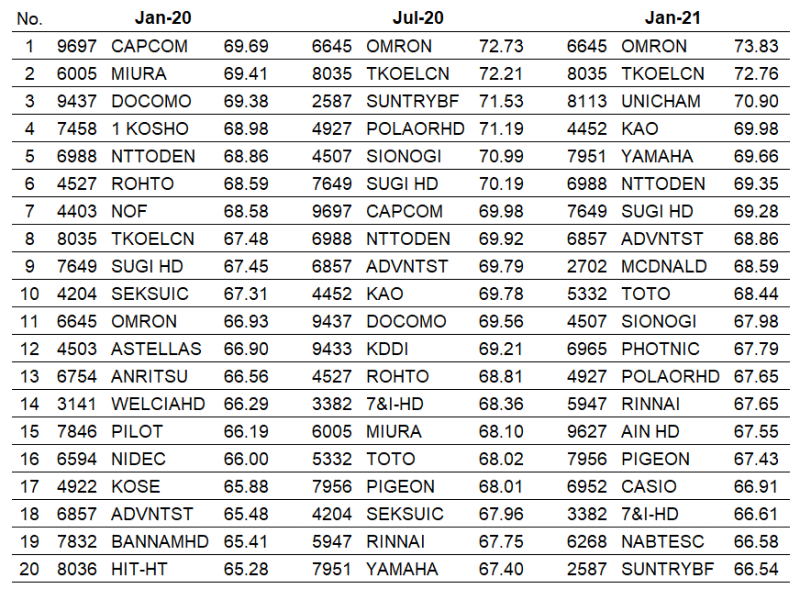
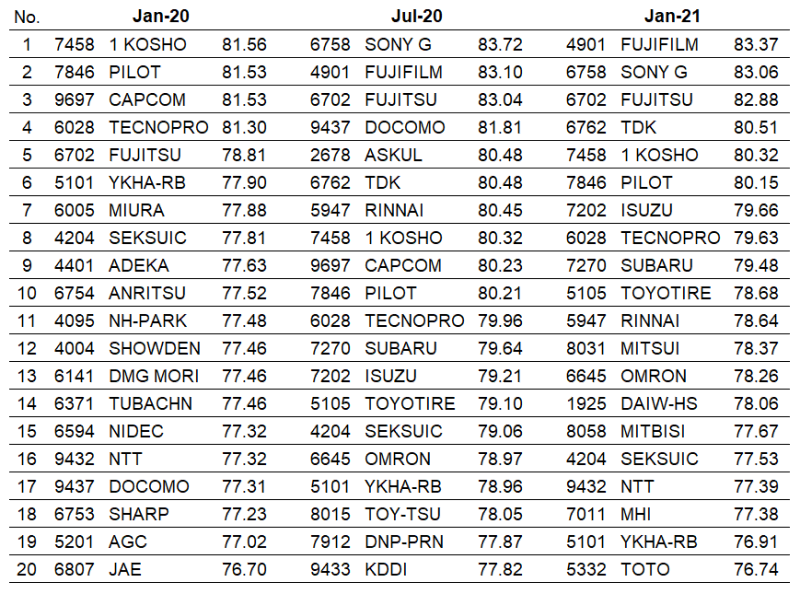
(5) Stocks selected for index inclusion (20 stocks with the top ESG scores chosen from a pool of 100 stocks)
The following tables show the top 20 stocks for each score among the selected stocks. Looking at the stocks with top ESG scores among those selected, we can see a number of companies that are considered to have excellent disclosure practices, including OMRON Corporation (6645) and Asahi Group Holdings, Ltd. (2502). It can be said that companies that consider ESG issues to be important for management and engage in careful dialogue with investors are highly evaluated.
Index 1: ESG total score
Index 2: ESG sub-score (E)
Index 3: ESG sub-score (S)
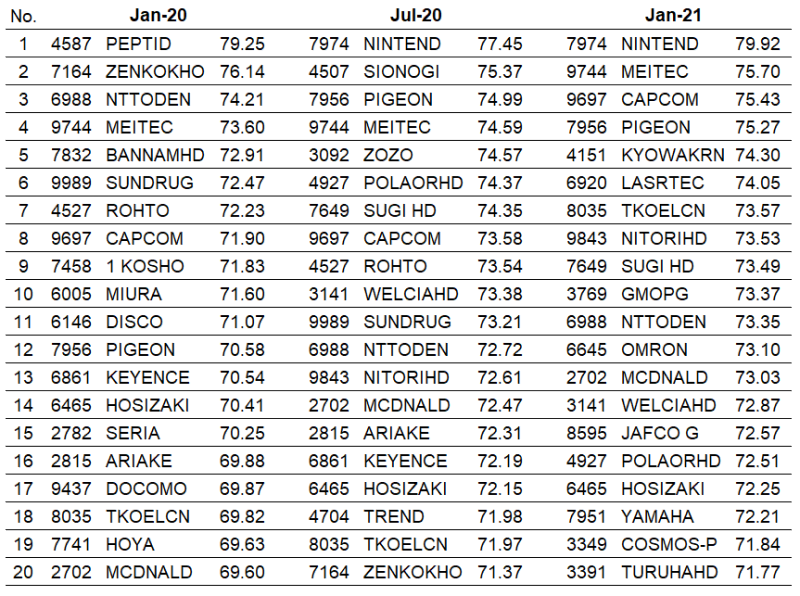
Index 4: ESG sub-score (G)
3. Estimated Results of the Indices
The following are the estimated results regarding the performance of the indices.
From the end of August 2017 to the end of July 2021, the index based on the ESG total score showed higher stock returns than TOPIX. Looking at the ESG sub-scores, which are evaluations that only consider the characteristics of each ESG theme, only the ESG sub-score for governance (G) resulted in higher stock returns than TOPIX.
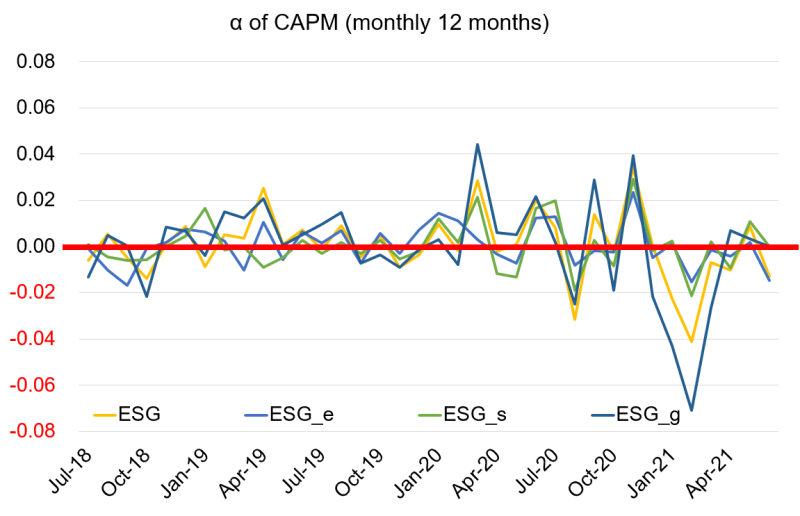
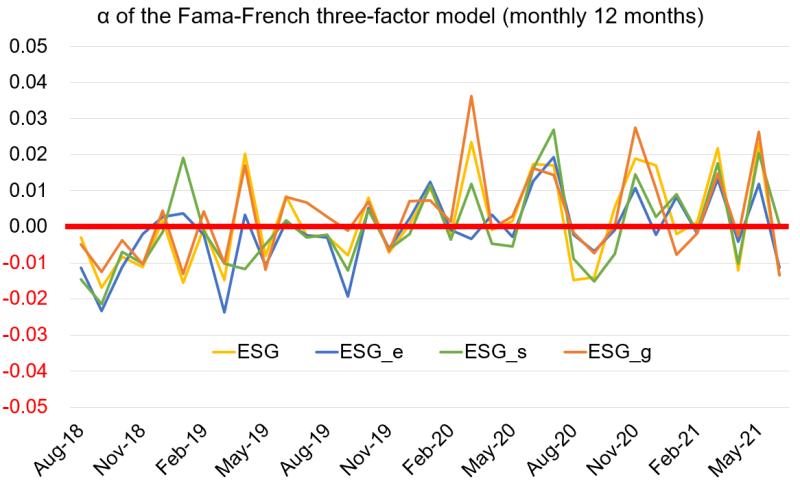
The indices created using the ESG score in this study also demonstrated higher investment efficiency than TOPIX. However, when considering the alpha of the CAPM and Fama-French three-factor model, both scores showed variations from month to month, and the source of the excess returns was not always clear. In the future, companies will be required to disclose more non-financial information, and it will become clearer what factors affect risk and return.
(1) Stock returns
(2) Sharpe ratio
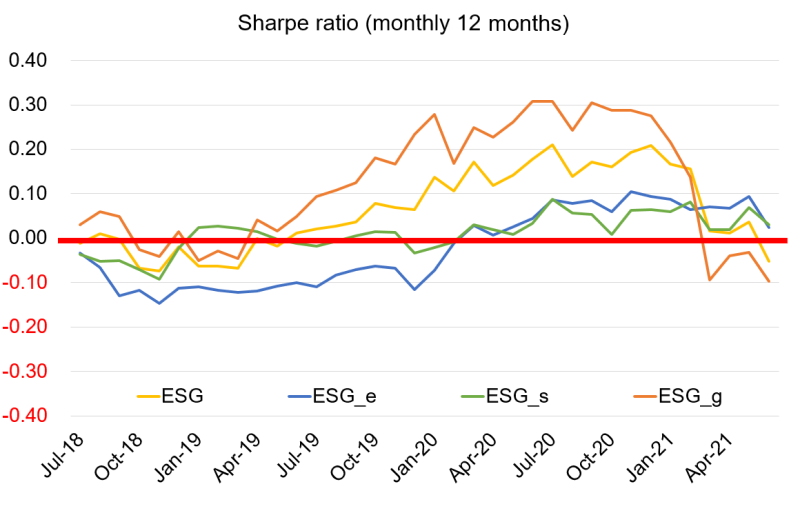
(Note) The figure shows the Sharpe ratio for each index minus the TOPIX Sharpe ratio.
(3) α of CAPM
(4) α of the Fama-French three-factor model
4. ESG Information is Increasingly Positioned as a Key Factor for Stock Investment
In the future, ESG information will be increasingly positioned as an important factor when investing in stocks. Currently, institutional investors are using ESG information to strengthen their engagement with companies. In addition, the Japan Exchange Group (JPX) has also expressed its ESG-oriented stance. We hope that the content of this study will help you in your future investment analysis.
QUICK

Since its founding in 1971, QUICK has become Japan's largest financial information vendor, and has developed an information infrastructure that supports Japan's securities and financial markets. It delivers high-value global market information from a fair and impartial perspective to a wide range of customers including securities firms, banks, institutional investors and corporations.
See More